
Case study · Food & catering · Shopify
R&S Sandwiches: from $809 in month one to $132,041 this year
A Melbourne catering business that opened with no audience, no reviews and no search history. We produced the launch campaign, then built and have run their search presence ever since: organic search, Google Ads and the content underneath both. This page shows what the till has done over those three years, and is straight about which parts of it we can and cannot claim.
- Google Ads
- SEO
- Meta Ads
- Content

The client
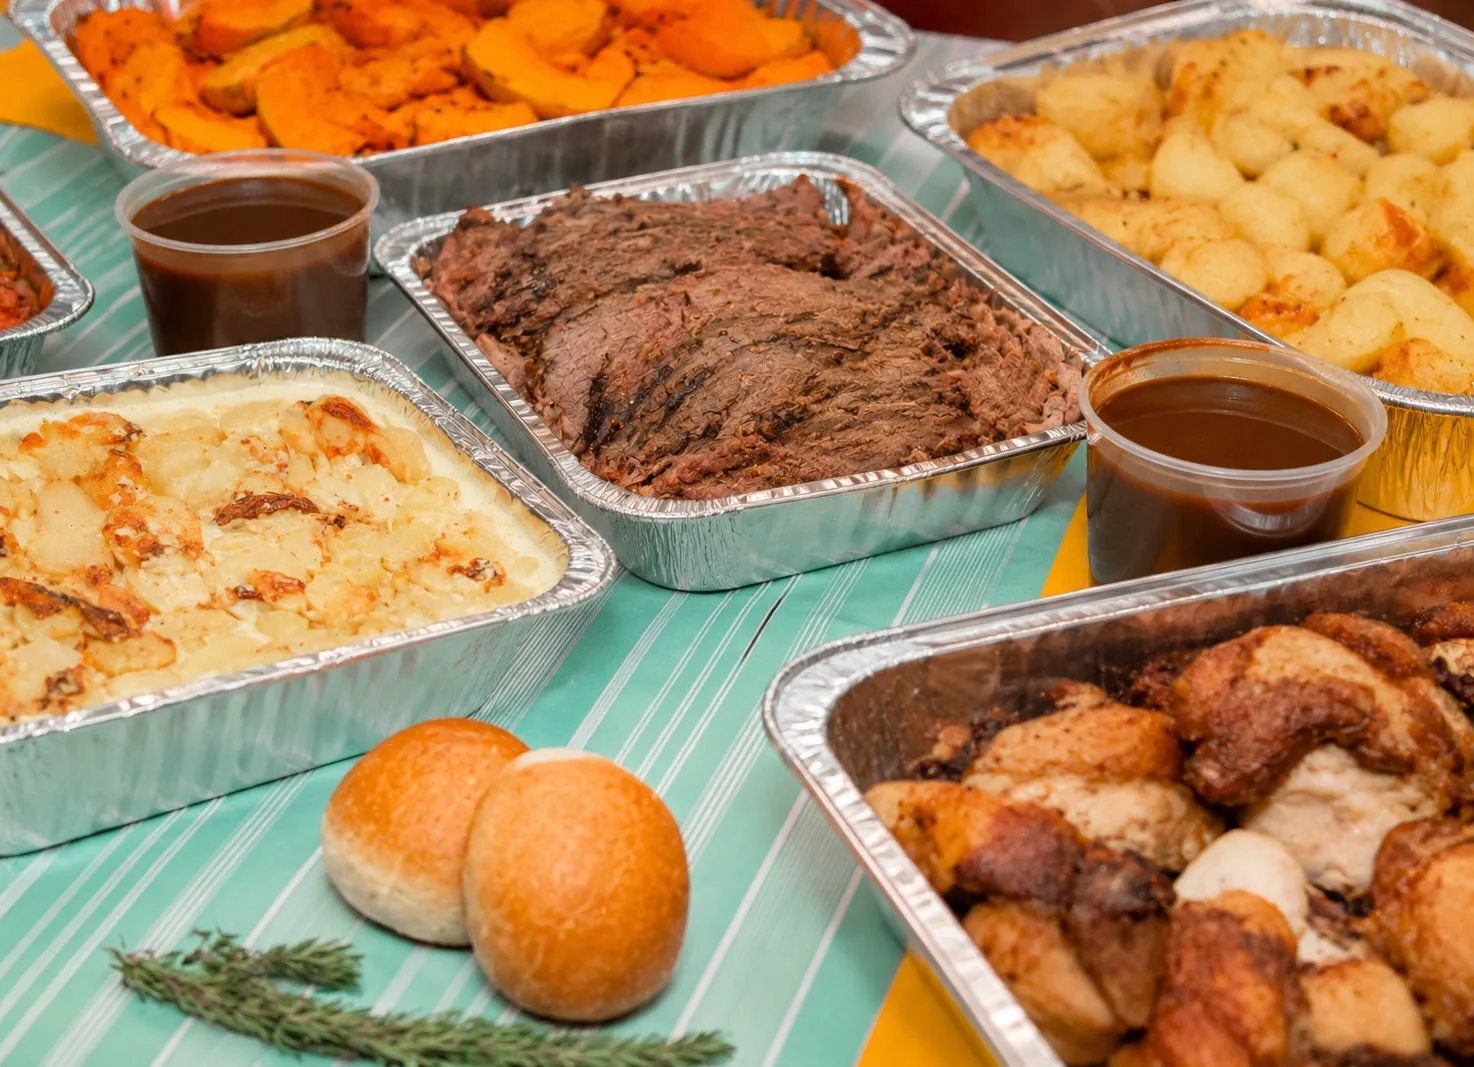
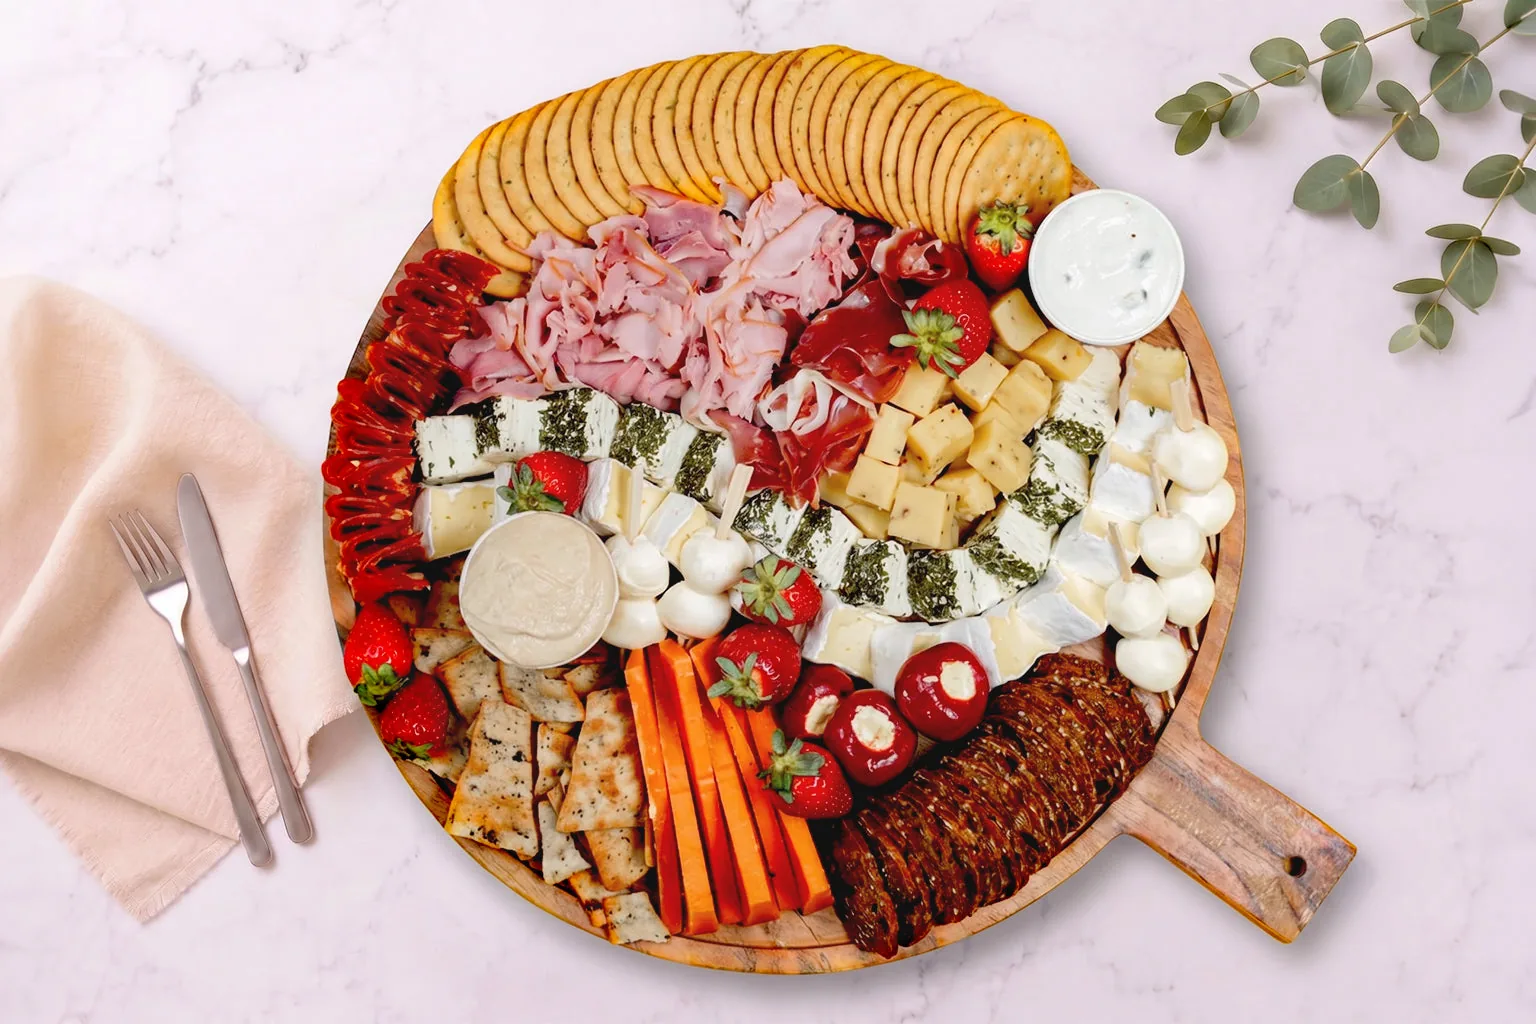
R&S Sandwiches. R&S Sandwiches is a Melbourne catering business known for fresh ingredients, custom sandwich orders, roast catering and gourmet platters for business lunches and events.
The need
They were opening, not growing. That meant building an audience from zero while the doors were already open.
- No audience yet. A new business with no followers, no reviews and no search history to build on.
- A crowded local market. Catering in Melbourne is competitive, and they needed to be the obvious choice for office lunches and events from the start.
- Two jobs at once. Fast awareness for the launch, and a slower search foundation that would keep enquiries coming once the launch spend stopped.
The plan
Script before you shoot
Video concepts and several sets of hooks written first, so every piece of content had a job.
Make it in house
Our creators filmed the videos and our designers made the static ads, so the look stayed consistent.
Test the creative
A Meta campaign structured so every hook and format competed for budget.
Then build the search presence
Organic search and Google Ads together, aimed at the office lunch, platter and event searches that turn into orders.
The execution
Step 1: the launch creative
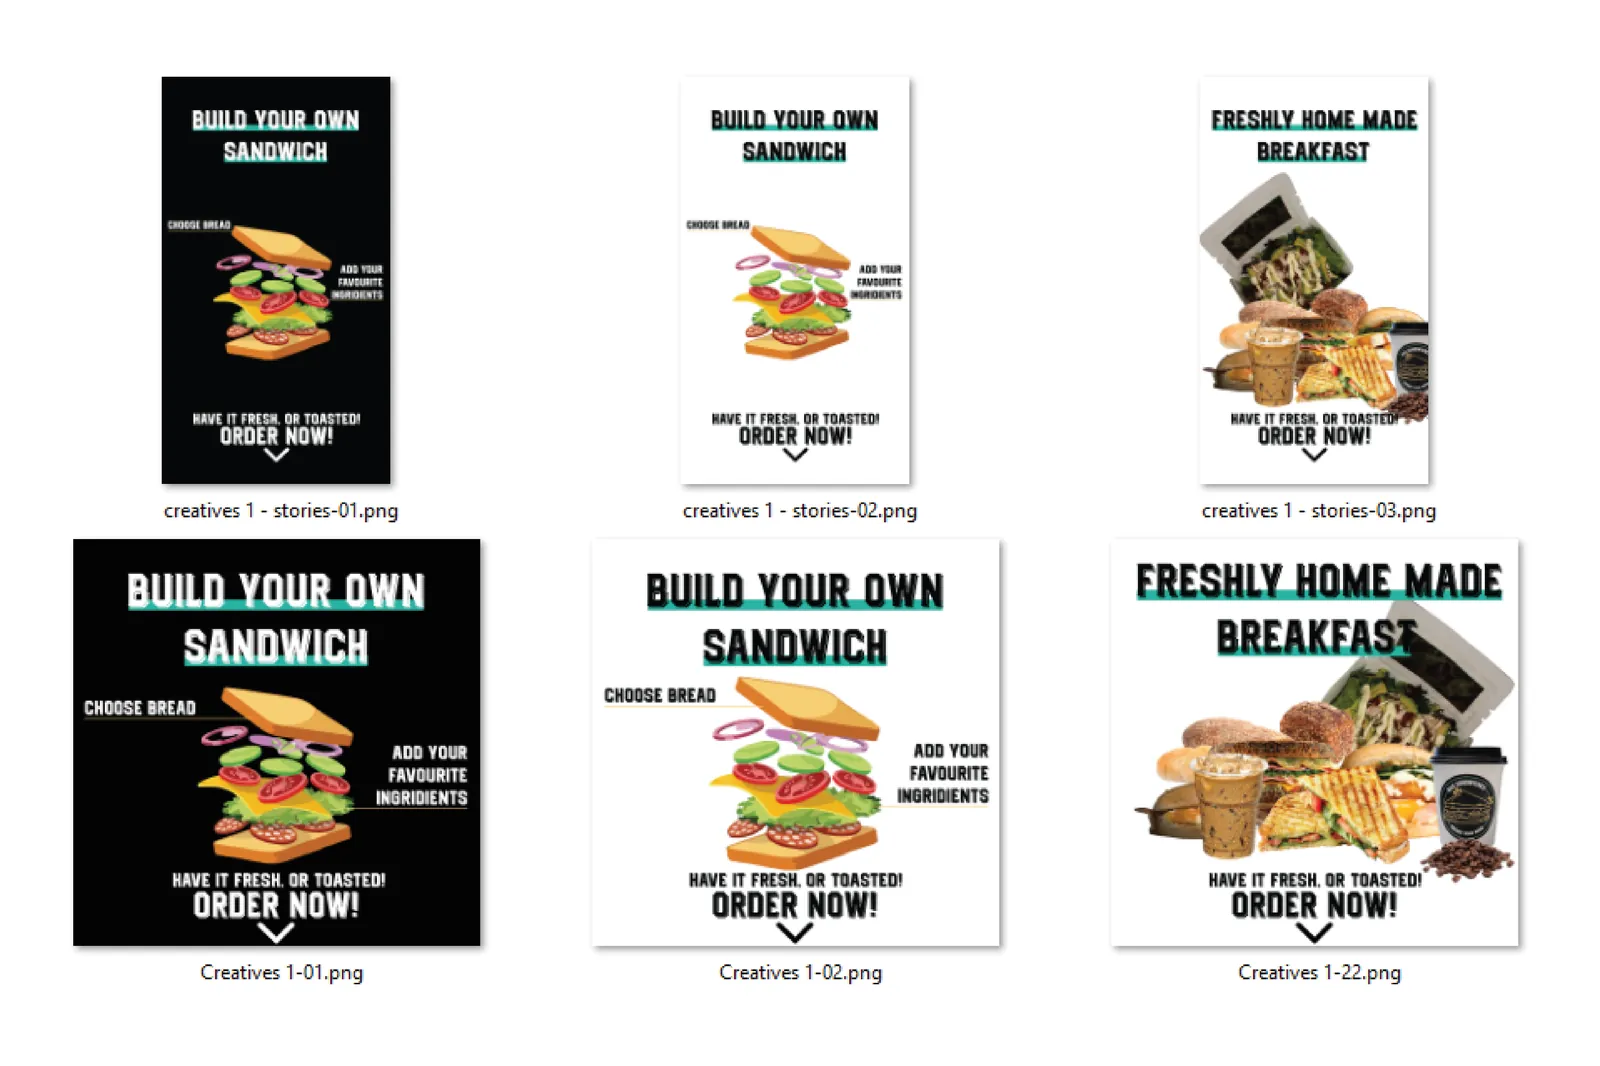
We wrote the video concepts and several hooks for each, our creators filmed to those scripts, and the design team built the static artwork to match. Every video was cut into one version per hook, so the campaign could find out which opening actually stopped the scroll.
Step 2: campaign setup and creative testing
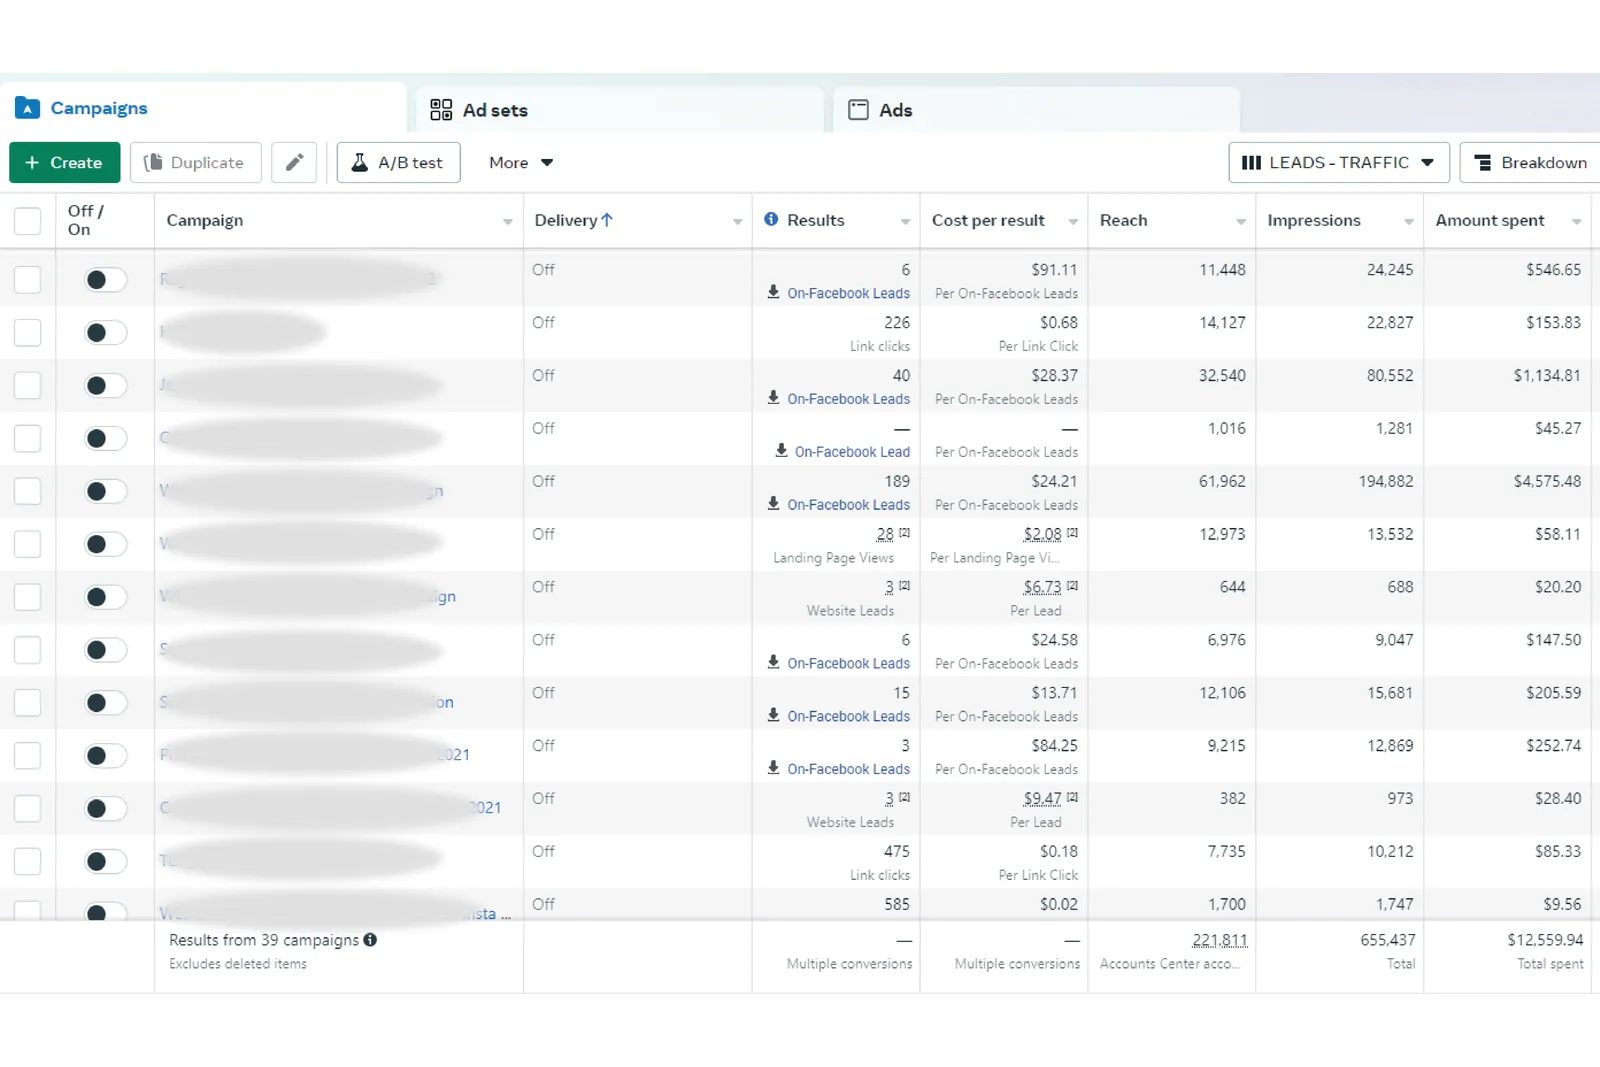
The Meta campaign was structured with separate ad sets and ads for each variation, so results could be compared like for like.
Step 3: collection and product pages that match the search
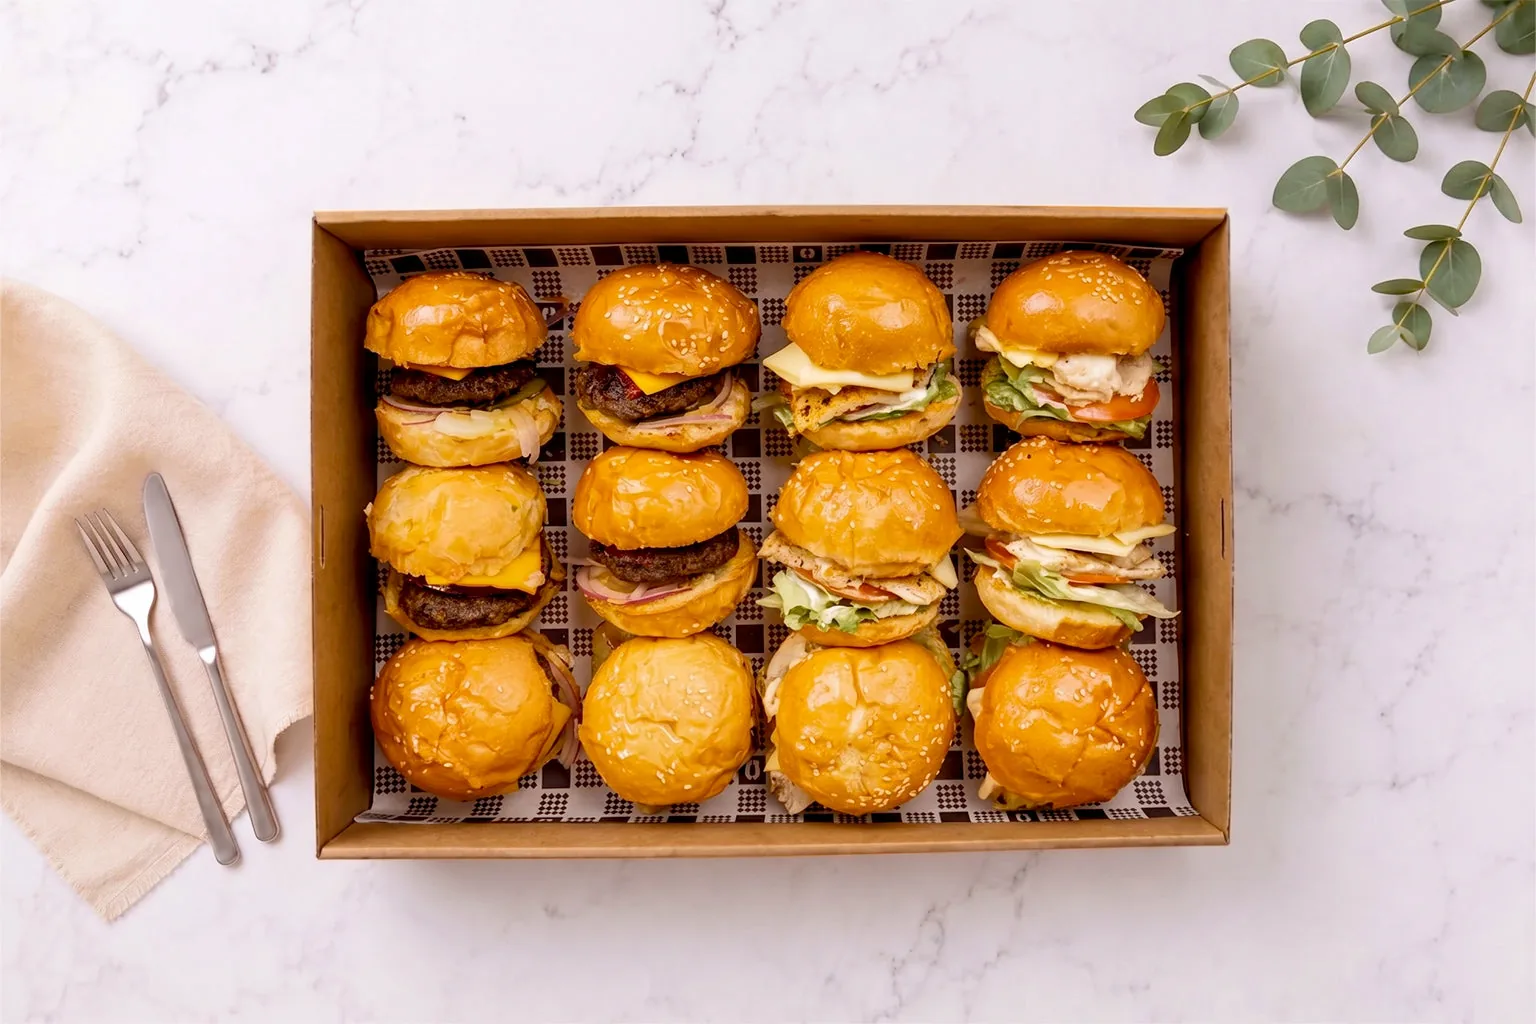
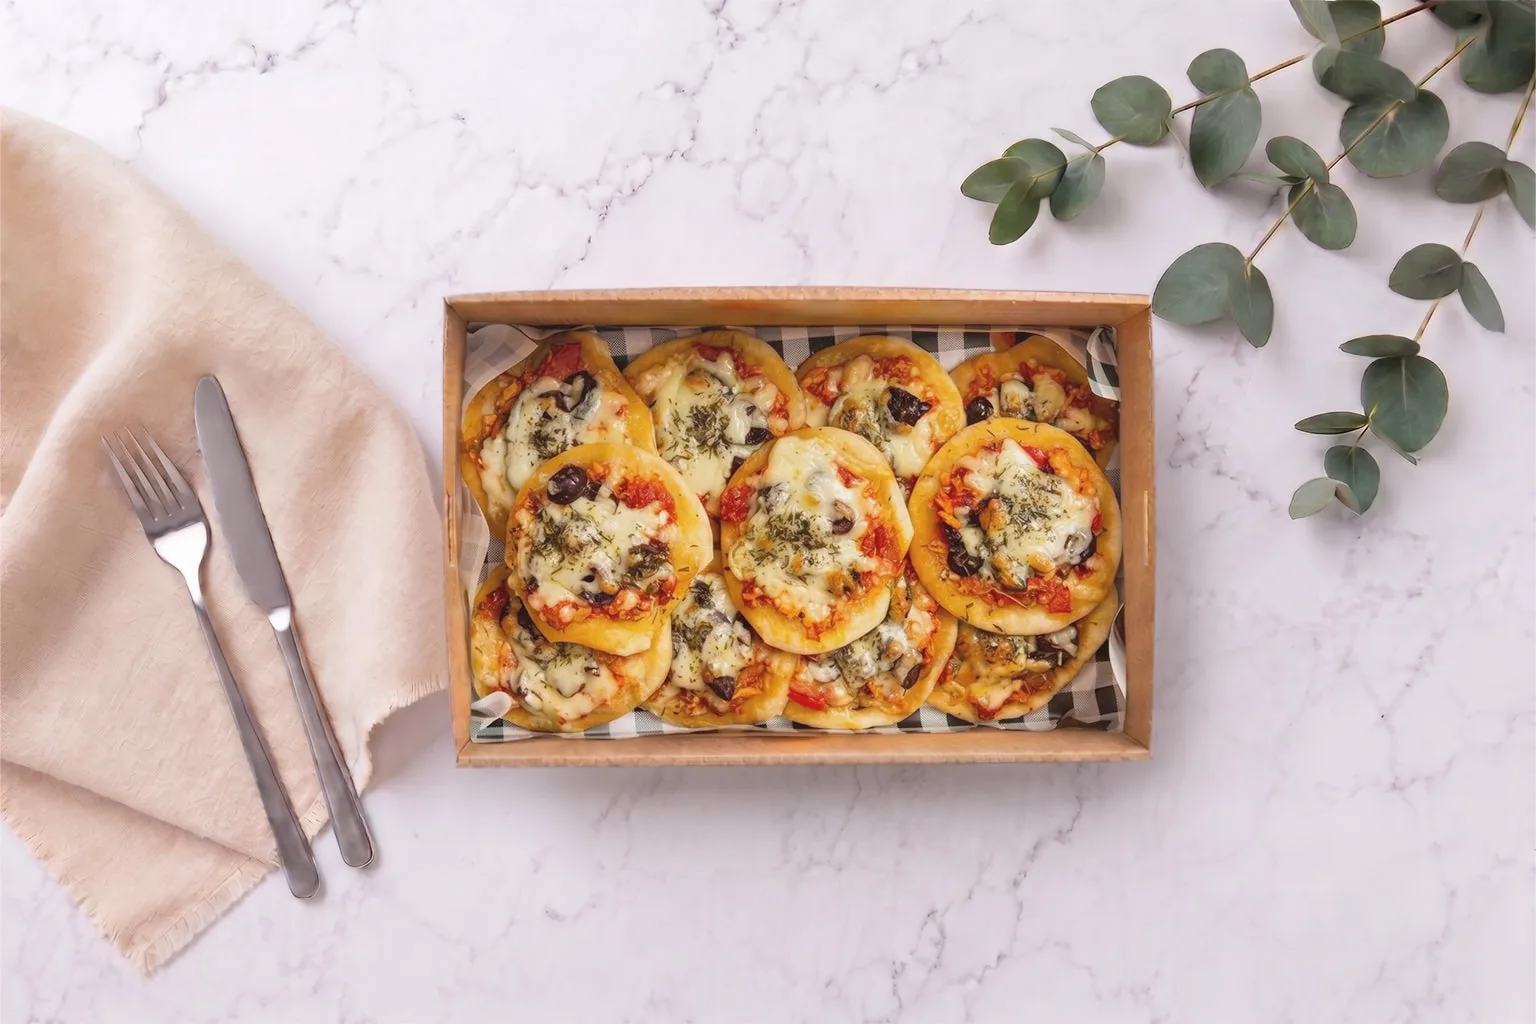
Their catering range was reorganised around what people actually type: slider platters, grazing platters, breakfast catering, corporate lunches. Each one a page that can rank, rather than a filter on a menu.
Step 4: content aimed at the questions before the order
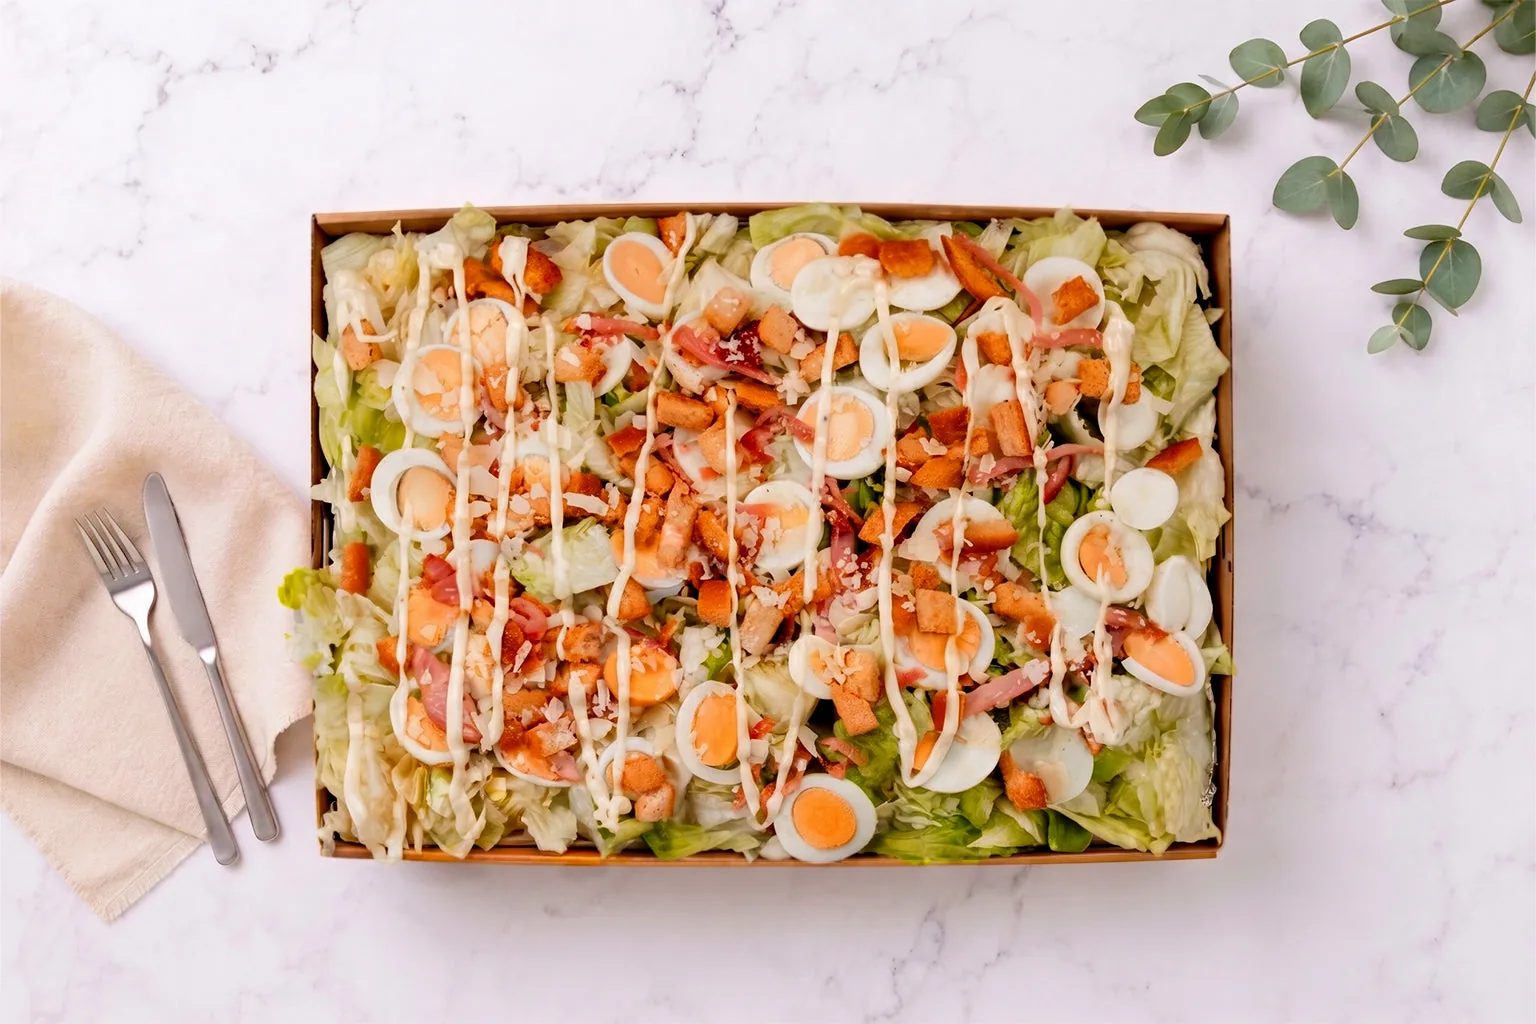
Platter ideas, finger food for events, how much to order per head. The questions people ask before they are ready to buy, answered on pages that link back to the range.
Step 5: Google Ads running alongside
A search campaign covering the catering terms worth paying for while the organic pages built up, and still running three years later.
The results
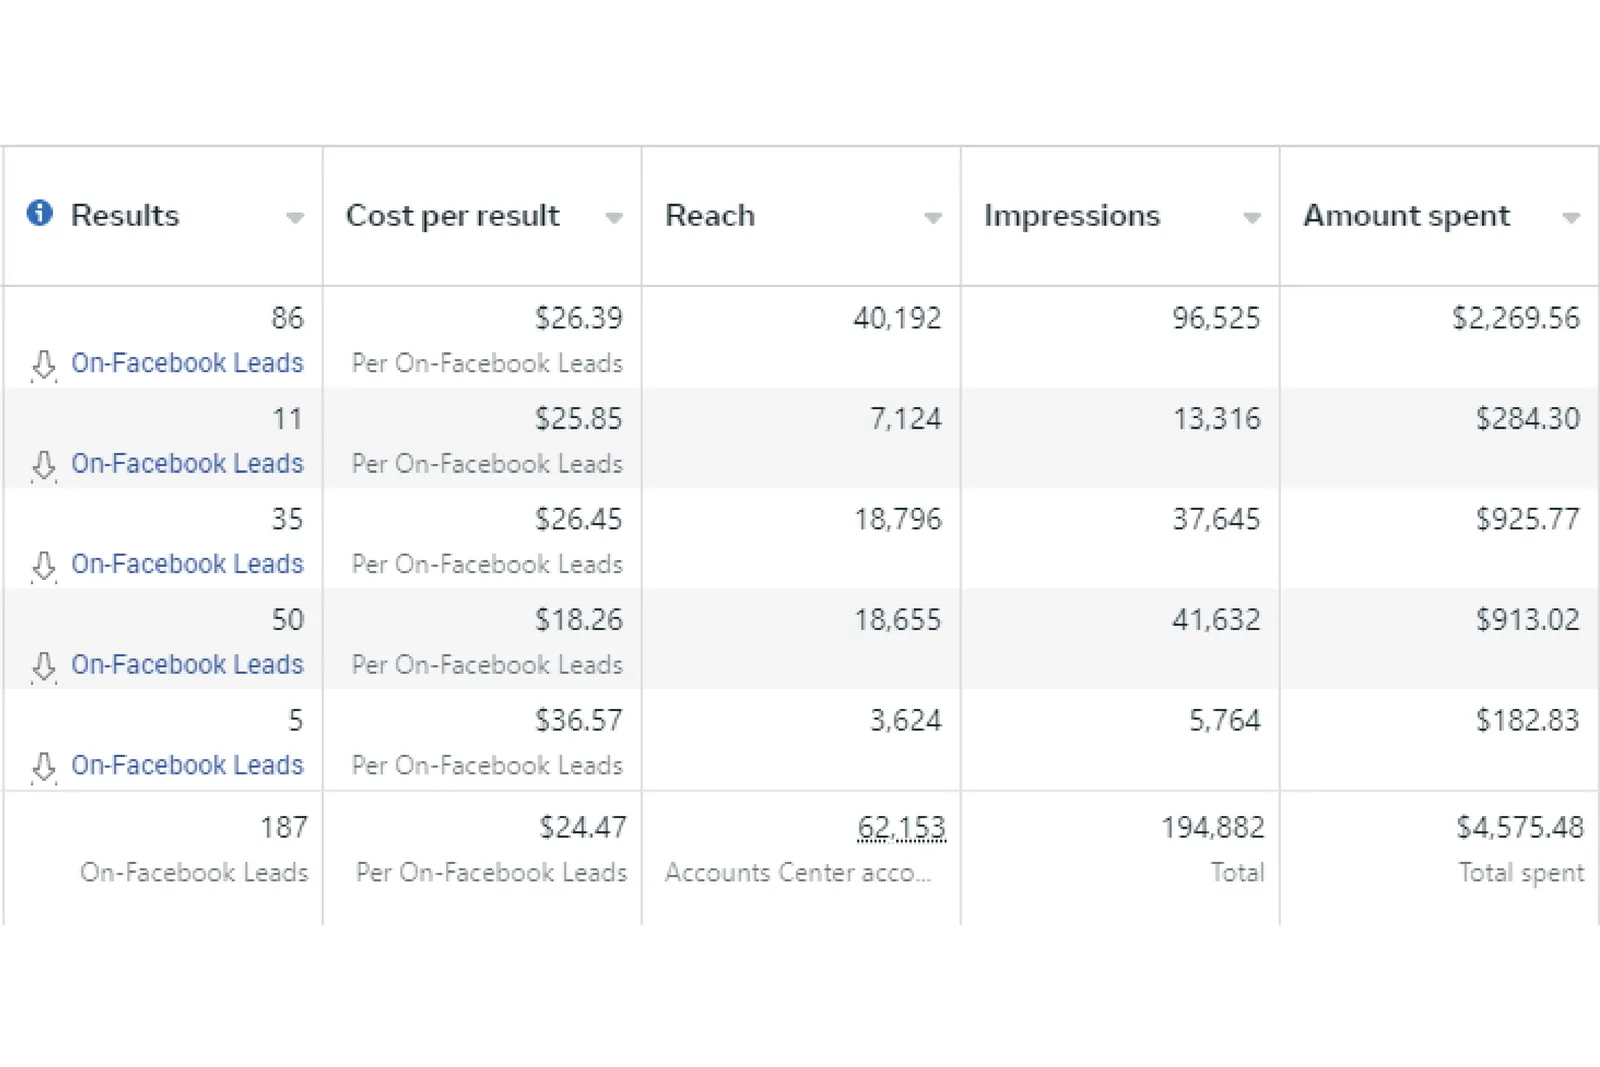
The launch campaign produced 187 leads in four weeks at $24.47 each. What happened after it is the part that matters. Their first trading month, November 2023, took $809.28 from four orders. October 2026 took $14,868.42 from thirty. Measured like for like, January to October, revenue went from $35,884 in 2024 to $132,041 in 2026.
See the numbers
| Period | Revenue a month, all channels |
|---|---|
| Nov 23 | $809 |
| Dec 23 | $1,100 |
| Jan 24 | $3,743 |
| Feb 24 | $4,526 |
| Mar 24 | $4,120 |
| Apr 24 | $4,195 |
| May 24 | $4,012 |
| Jun 24 | $2,696 |
| Jul 24 | $3,106 |
| Aug 24 | $4,807 |
| Sep 24 | $570 |
| Oct 24 | $4,109 |
| Nov 24 | $1,354 |
| Dec 24 | $3,273 |
| Jan 25 | $788 |
| Feb 25 | $4,515 |
| Mar 25 | $4,750 |
| Apr 25 | $2,882 |
| May 25 | $5,203 |
| Jun 25 | $5,708 |
| Jul 25 | $4,923 |
| Aug 25 | $5,492 |
| Sep 25 | $7,906 |
| Oct 25 | $7,706 |
| Nov 25 | $13,083 |
| Dec 25 | $12,677 |
| Jan 26 | $12,531 |
| Feb 26 | $17,836 |
| Mar 26 | $10,367 |
| Apr 26 | $13,486 |
| May 26 | $6,888 |
| Jun 26 | $11,202 |
| Jul 26 | $18,986 |
| Aug 26 | $13,894 |
| Sep 26 | $11,983 |
| Oct 26 | $14,868 |
Source: client's Shopify admin, all sales channels, 1 Nov 2023 to 31 Oct 2026.
See the numbers
| Period | Revenue, January to October |
|---|---|
| Jan to Oct 2024 | $35,884 |
| Jan to Oct 2025 | $49,873 |
| Jan to Oct 2026 | $132,041 |
Source: client's Shopify admin, all sales channels, 1 Nov 2023 to 31 Oct 2026.
See the numbers
| Period | Average order value |
|---|---|
| Jan to Oct 2024 | $262 |
| Jan to Oct 2025 | $308 |
| Jan to Oct 2026 | $491 |
Source: client's Shopify admin, all sales channels, 1 Nov 2023 to 31 Oct 2026.
The conclusion
Three years in, R&S take more through the checkout in a single month than they took in their first six. The orders roughly doubled and the average order nearly doubled on top, which is a business winning bigger catering jobs rather than simply more small ones. We have run their search presence throughout, and we are not going to pretend we can split the credit to the dollar: most of their orders arrive with no referrer attached, so nobody can. What we can show is the work, the three years, and the till.
Revenue and order figures from the client's Shopify admin, all sales channels, 1 November 2023 to 31 October 2026. November 2026 is excluded as an incomplete month. Launch figures from the client's Meta Ads Manager, first four weeks. Google Ads figures from the client's Google Ads account, account lifetime to 21 November 2026. Search impressions from Google Search Console, 19 July 2025 to 18 November 2026. Shopify records no referrer against 93.5% of orders, so we do not state a revenue share or a return on ad spend for any single channel.
More work like this
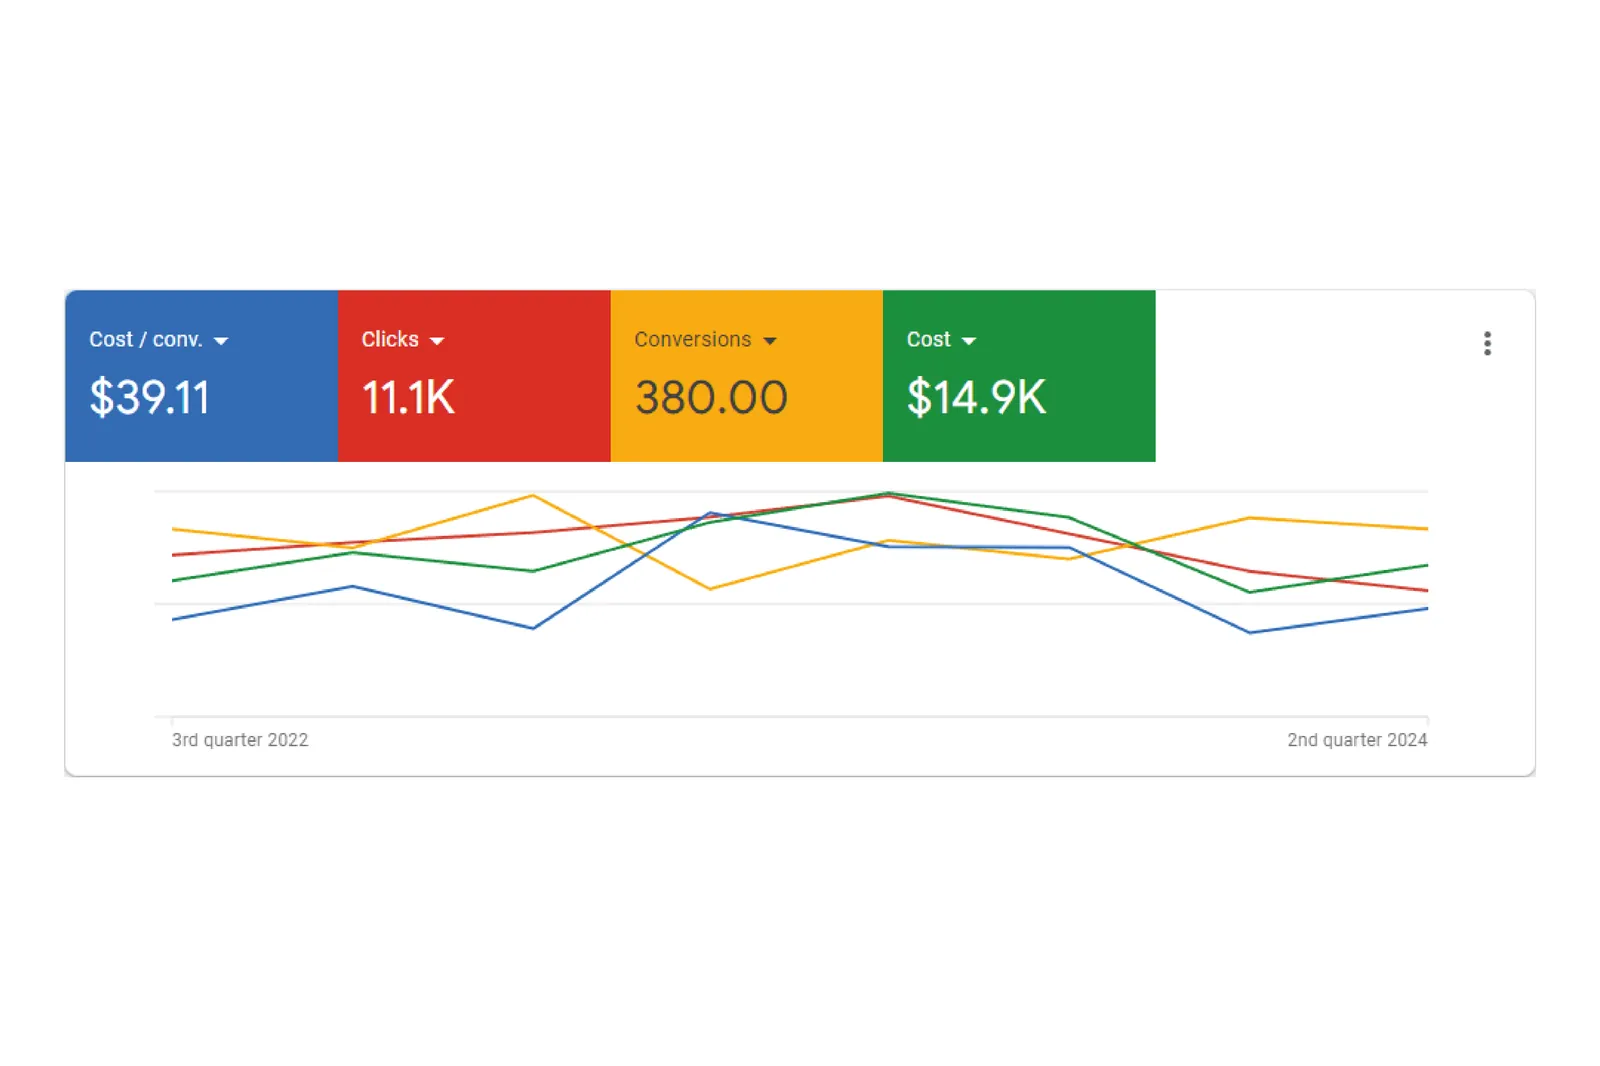
Tracking and a rebuilt account turned unmeasured ads into an enquiry every two days.
View case study →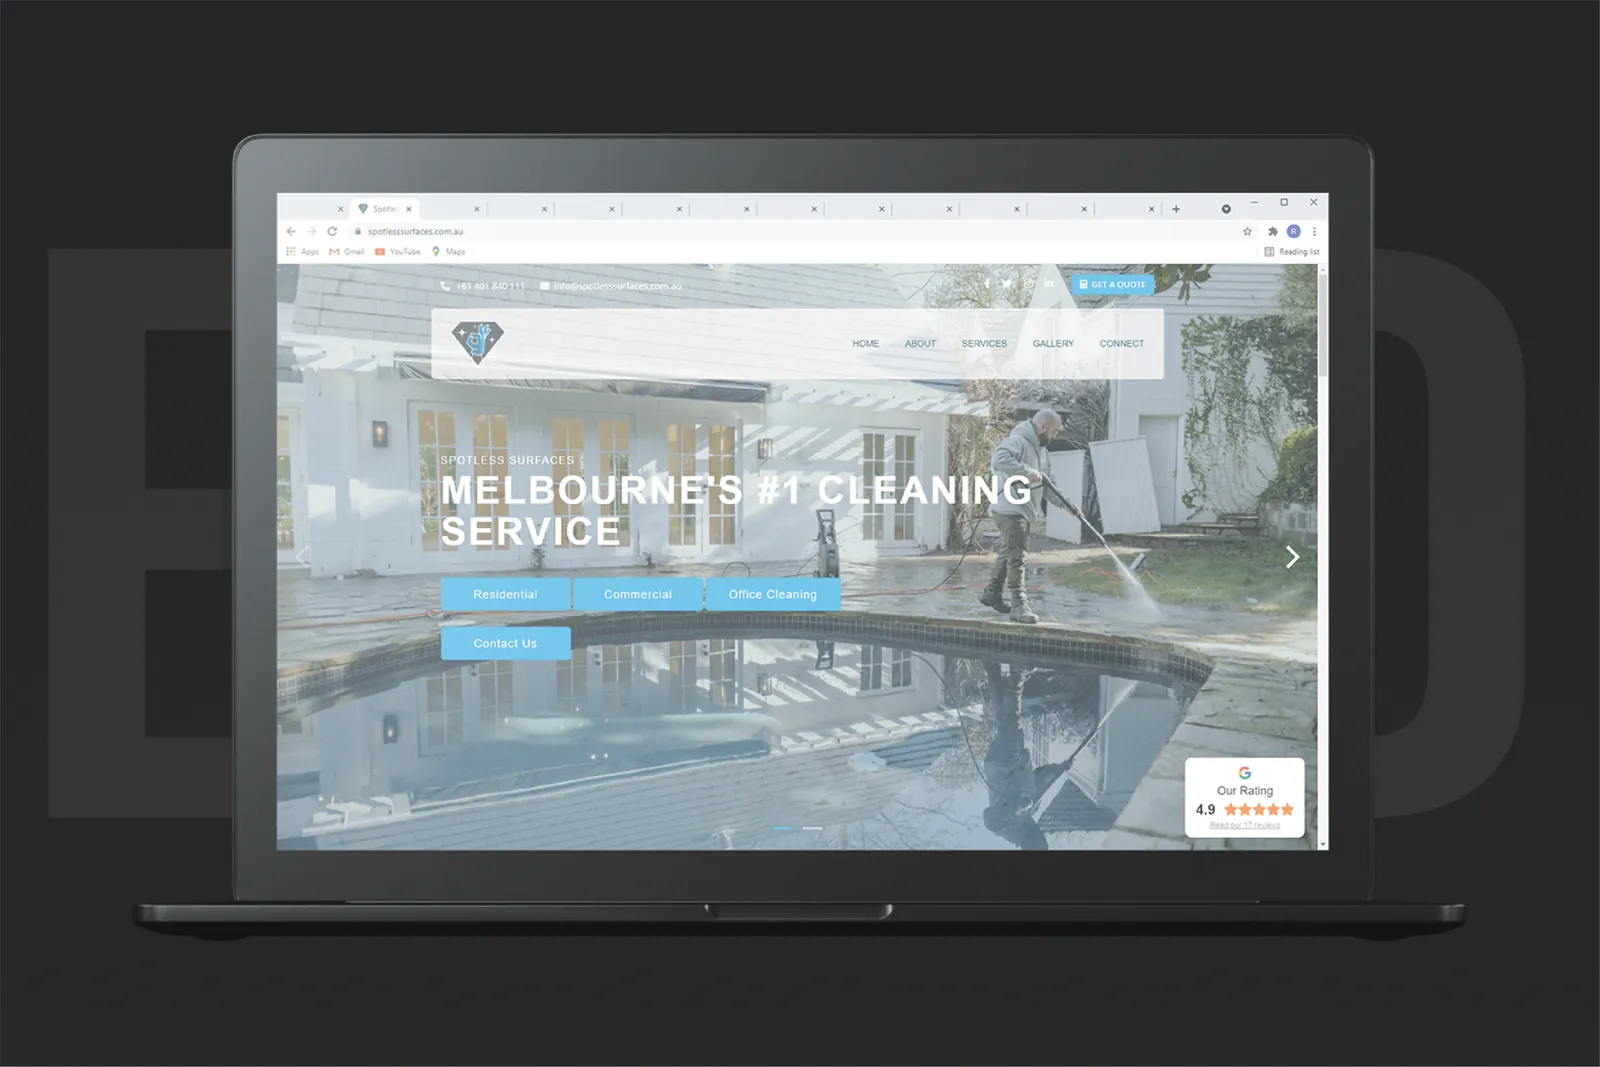
A new brand, a website with instant quotes, and a following that grew from 300 to almost 4,000.
View case study →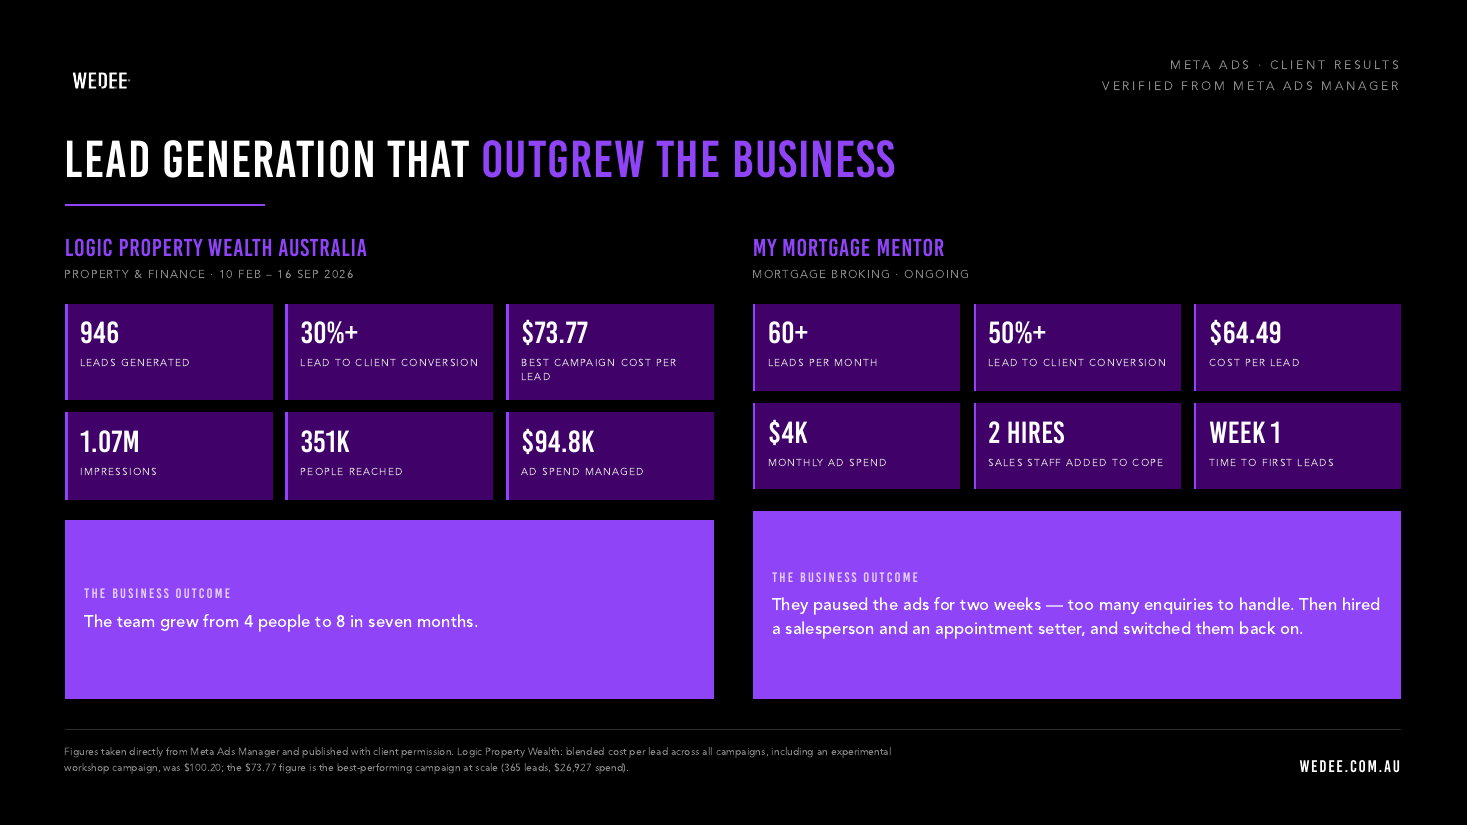
Finance leads at scale, and a team that grew from four to eight in seven months.
View case study →